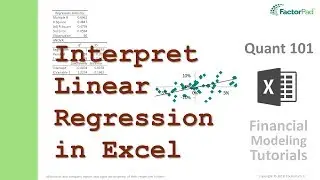
Generate and interpret a linear regression in Excel | Financial Modeling Tutorials
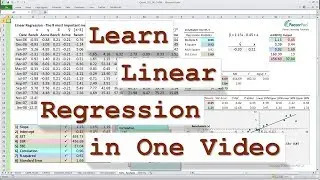
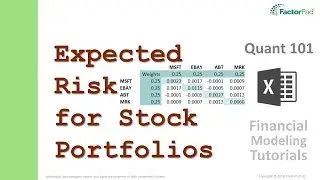
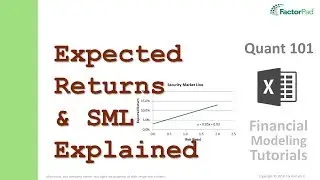
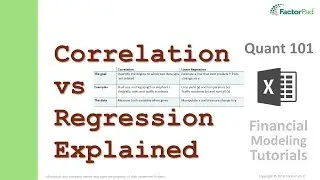
A financial modeling tutorial using linear regression analysis with Excel's Data Analysis and using Excel regression functions and interpret regression output to set expected returns on stocks in a data analytics course Quant 101.
For the video transcript including all formulas see:
https://factorpad.com/fin/quant-101/i...
Zoom straight to the section you are interested in:
01:02 - Video Outline
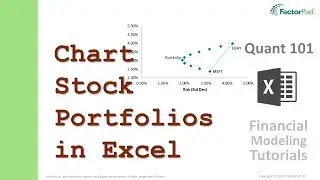
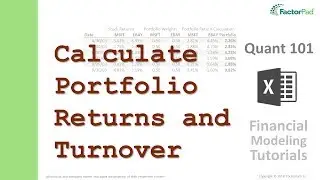
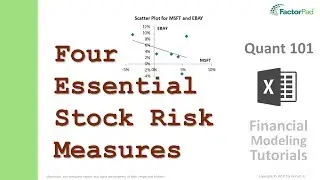
01:40 - Step 1 - Create a Scatter Plot in Excel
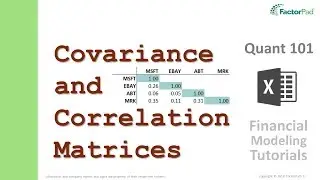
06:07 - Step 2 - Excel Data Analysis of Regressions
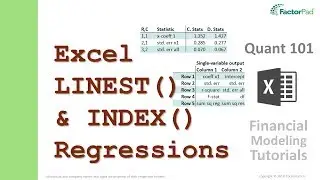
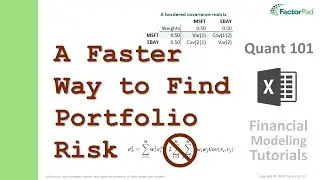
08:46 - Step 3 - Excel Regression Functions
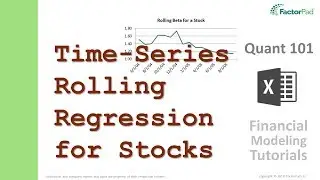
11:07 - Step 4 - Interpret Financial Time-Series
17:38 - Summary
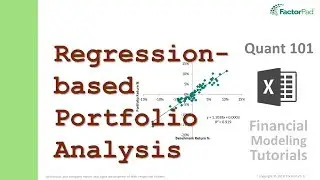
18:32 - Step 5 - Next: Portfolio Performance
For the outline to the Playlist see:
https://factorpad.com/fin/quant-101/q...
See what else there is to learn at:
https://factorpad.com
Happy Learning!
Watch video Generate and interpret a linear regression in Excel | Financial Modeling Tutorials online, duration hours minute second in high quality that is uploaded to the channel FactorPad 17 May 2018. Share the link to the video on social media so that your subscribers and friends will also watch this video. This video clip has been viewed 5,623 times and liked it 55 visitors.