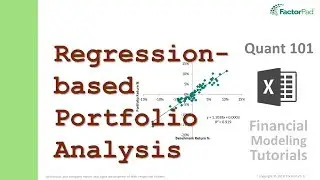
Analyze portfolio performance with linear regression in Excel | Financial Modeling Tutorials
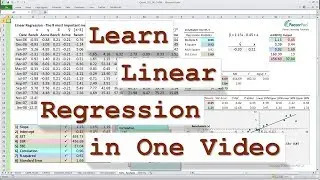
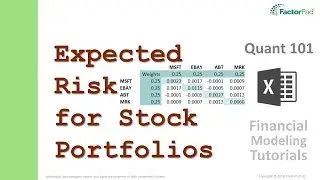
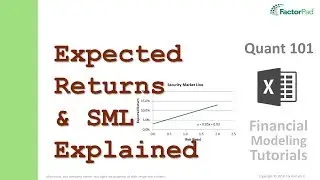
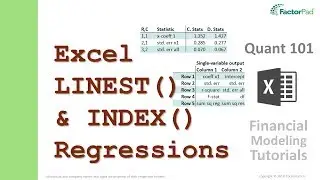
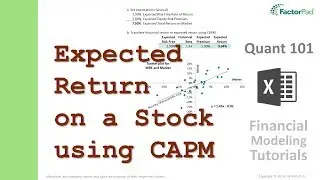
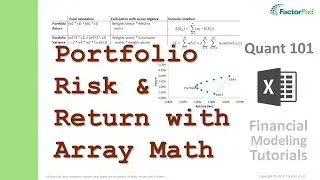
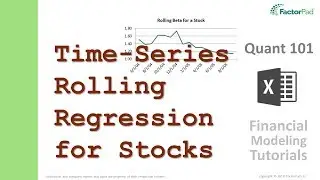
A financial modeling tutorial on analyzing portfolio performance with single-variable linear regression in Excel of an active portfolio and benchmark return using the Sharpe Ratio, Treynor Ratio and Jensen's Alpha in the Quant 101 data analysis course.
Find the video transcript and Excel formulas here:
https://factorpad.com/fin/quant-101/p...
Zoom straight to the section you are interested in here:
00:52 - Video outline
01:26 - Step 1 - Portfolio Performance Basics
05:58 - Step 2 - Build an Active Portfolio
15:36 - Step 3 - Three Portfolio Performance Measures
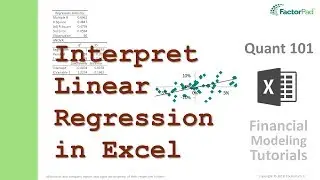
19:07 - Step 4 - Interpret Portfolio Performance
20:00 - Video Summary
20:52 - Step 5 - Time-Series Modeling
For the outline to the Series see:
https://factorpad.com/fin/quant-101/q...
See what else will help with your investment career at:
https://factorpad.com
Happy Learning!
Watch video Analyze portfolio performance with linear regression in Excel | Financial Modeling Tutorials online, duration hours minute second in high quality that is uploaded to the channel FactorPad 20 May 2018. Share the link to the video on social media so that your subscribers and friends will also watch this video. This video clip has been viewed 18,526 times and liked it 174 visitors.