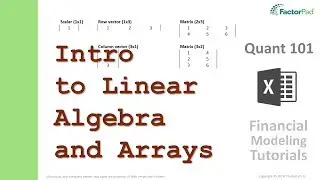
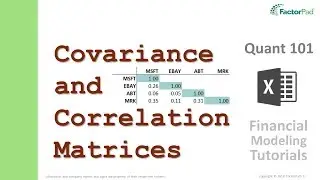
Charting stock portfolios with a scatter plot in Excel | Financial Modeling Tutorials
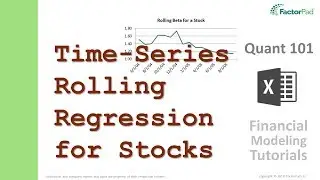
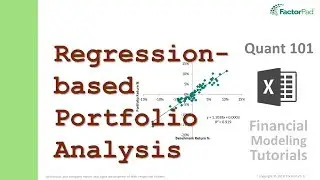
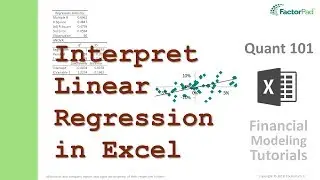
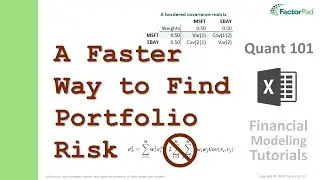
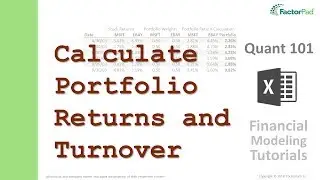
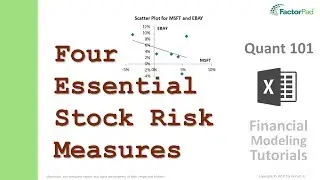
A financial modeling tutorial on charting stock portfolios in Excel after changing weights and monitoring average portfolio returns and portfolio variance using covariance and variance for two stocks.
Find the full transcript and Excel cell formulas here:
https://factorpad.com/fin/quant-101/c...
Zoom straight to the section you are interested in here:
00:50 - Tutorial Outline
01:25 - Step 1 - Review the Inputs
06:19 - Step 2 - Create Eleven Two-Stock Portfolios
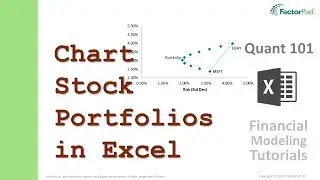
12:08 - Step 3 - Create a Risk and Return Plot
13:45 - Step 4 - Looking Forward
15:20 - Step 5 - Next: Portfolio Theory
For the outline to all tutorials see:
https://factorpad.com/fin/quant-101/q...
For our other Finance and Technology tutorials see:
https://factorpad.com
Happy Learning!
Watch video Charting stock portfolios with a scatter plot in Excel | Financial Modeling Tutorials online, duration hours minute second in high quality that is uploaded to the channel FactorPad 30 April 2018. Share the link to the video on social media so that your subscribers and friends will also watch this video. This video clip has been viewed 8,311 times and liked it 40 visitors.