Time-series analysis of stock return regressions in Excel | Financial Modeling Tutorials
A financial modeling tutorial on time-series analysis of regression statistics in Excel including issues like seasonality, autocorrelation, multicollinearity and heteroscedasticity in the Quant 101 data analysis course.
For the video transcript and cell formulas see:
https://factorpad.com/fin/quant-101/t...
Zoom straight to the section you are interested in here:
01:03 - Video Outline
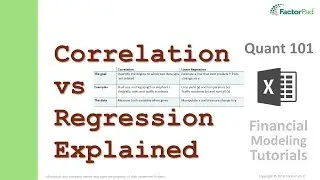
01:33 - Step 1 - Two Types of Regression in Finance
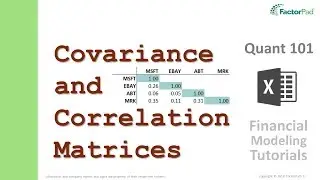
02:42 - Step 2 - Time-Series Details
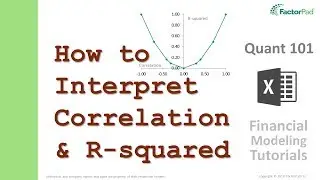
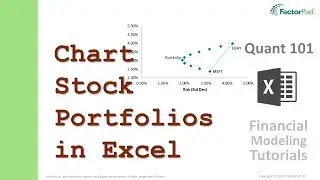
09:29 - Step 3 - The Case for Visualization
09:59 - Step 4 - Common Estimation Issues
15:05 - Summary
16:00 - Next: Linear Algebra in Excel
For the outline to the Series see:
https://factorpad.com/fin/quant-101/q...
See what else you can learn at:
https://factorpad.com
Happy Learning!
Watch video Time-series analysis of stock return regressions in Excel | Financial Modeling Tutorials online, duration hours minute second in high quality that is uploaded to the channel FactorPad 22 May 2018. Share the link to the video on social media so that your subscribers and friends will also watch this video. This video clip has been viewed 12,936 times and liked it 94 visitors.