Generate and interpret a linear regression in Excel | Financial Modeling Tutorials
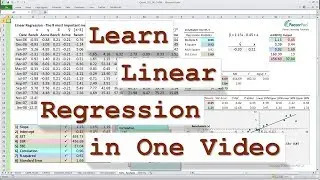
A financial modeling tutorial using linear regression analysis with Excel's Data Analysis and using Excel regression functions and interpret regression output to set expected returns on stocks in a data analytics course Quant 101.
For the video transcript including all formulas see:
https://factorpad.com/fin/quant-101/i...
Zoom straight to the section you are interested in:
01:02 - Video Outline
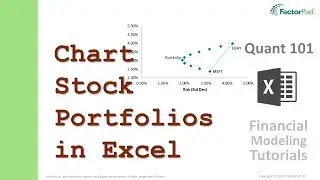
01:40 - Step 1 - Create a Scatter Plot in Excel
06:07 - Step 2 - Excel Data Analysis of Regressions
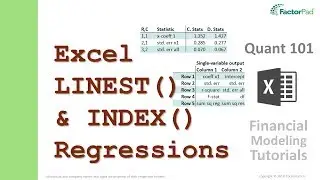
08:46 - Step 3 - Excel Regression Functions
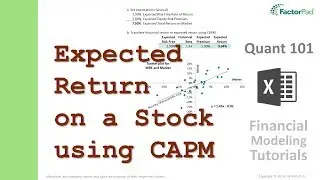
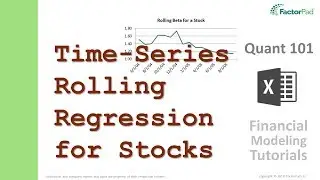
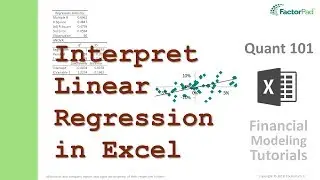
11:07 - Step 4 - Interpret Financial Time-Series
17:38 - Summary
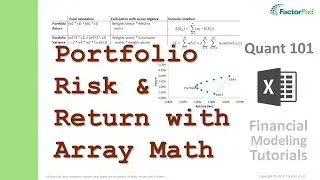
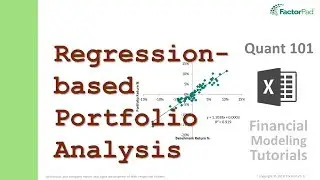
18:32 - Step 5 - Next: Portfolio Performance
For the outline to the Playlist see:
https://factorpad.com/fin/quant-101/q...
See what else there is to learn at:
https://factorpad.com
Happy Learning!
Смотрите видео Generate and interpret a linear regression in Excel | Financial Modeling Tutorials онлайн, длительностью часов минут секунд в хорошем качестве, которое загружено на канал FactorPad 17 Май 2018. Делитесь ссылкой на видео в социальных сетях, чтобы ваши подписчики и друзья так же посмотрели это видео. Данный видеоклип посмотрели 5,623 раз и оно понравилось 55 посетителям.