Interpolate Groundwater Quality Data in QGIS (Thiessen, IDW, Kriging)
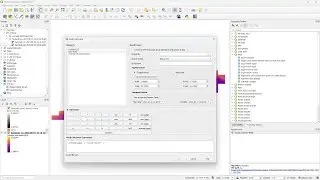
This video demonstrates how to interpolate groundwater quality data from a borehole point vector data set to rasters. Three methods were used: Thiessen polygons, Inverse Distance Weighting (IDW) and kriging. Results are styled and contour lines were visualised.
Open data: ORASECOM - http://gis.orasecom.org/layers/geonod..., (c) OpenStreetMap Contributors
QGIS version: 3.22
Plugin: Smart-Map - https://github.com/gustavowillam/Smar...
Step-by-step tutorial is freely available at GIS OpenCourseWare: https://courses.gisopencourseware.org...
0:00 Introduction and dataset
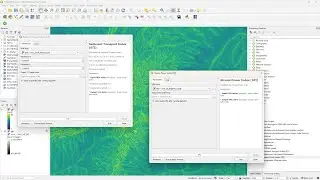
1:13 Import WFS data from GeoNode into QGIS
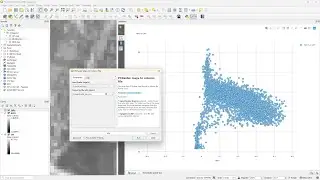
3.42 Remove nodata from data points
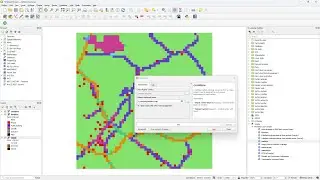
4:53 Interpolate with Thiessen method
6:11 Interpolate with IDW method
8:05 Interpolate with kriging method (Smart-Map plugin)
10:45 Compare results
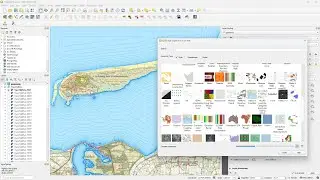
12:42 Render contour lines
13:52 Calculate contour lines
#QGIS #QGISHydro
Watch video Interpolate Groundwater Quality Data in QGIS (Thiessen, IDW, Kriging) online, duration hours minute second in high quality that is uploaded to the channel Hans van der Kwast 13 January 2023. Share the link to the video on social media so that your subscribers and friends will also watch this video. This video clip has been viewed 11,331 times and liked it 193 visitors.