Quick Flood Analysis with QGIS
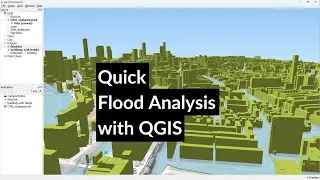
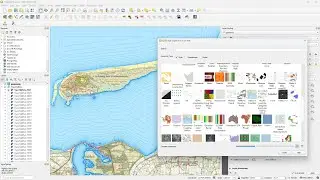
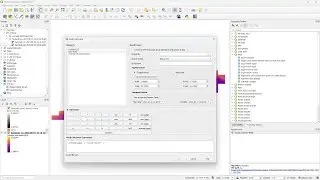
In this video, we'll use building footprints from OpenStreetMap, a DTM and a DSM to create 2D and 3D flood maps of a city. We'll start with preprocessing the data: interpolate voids in the DTM and extrude buildings, using the DSM and zonal statistics. Next, we'll prepare flood extent layers. Finally, we'll visualize the flood extent in 3D.
QGIS version: 3.34 Prizren
Open data: AHN, (c) OpenStreetMap contributors
Plugins: QuickOSM, PDOK Services, Qgis2threejs
0:00 Introduction
0:26 Download buildings from OpenStreetMap
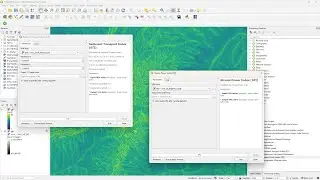
1:58 Download DTM and DSM via PDOK Services plugin
4:35 Interpolate voids in DTM
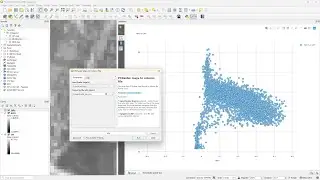
6:18 Calculate slope
7:18 Extrude buildings
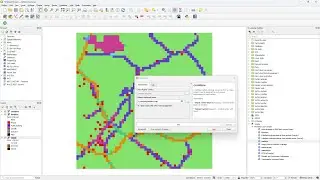
10:37 Prepare flood extent layer
12:56 3D visualization of flood extent
#QGIS #urban
Watch video Quick Flood Analysis with QGIS online, duration hours minute second in high quality that is uploaded to the channel Hans van der Kwast 06 February 2024. Share the link to the video on social media so that your subscribers and friends will also watch this video. This video clip has been viewed 17,394 times and liked it 488 visitors.