Revolutionize Dashboards: Excel Speedometers!
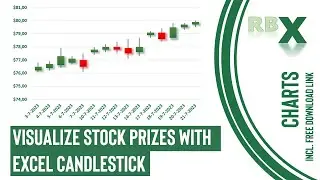
Welcome to a comprehensive tutorial on creating a powerful Speedometer Chart in Excel! Elevate your business dashboards and presentations with this step-by-step guide to crafting a dynamic speedometer. This visual element allows you to input a value, instantly reflected by the speedometer’s pointer. Learn how to generate values using formulas or functions to customize your dashboard precisely.
The initial phase involves setting up two essential tables—one for the doughnut chart and another for the pie chart. The doughnut chart forms the vibrant background, while the pie chart is essential for the needle. We'll cover inserting, colorizing, and adjusting the angles of both charts to create an engaging speedometer.
By the end of this tutorial, your speedometer will be nearly complete, leaving you the flexibility to add data labels according to your preferences and needs.
Excel Speedometer is your gateway to mastering impactful data visualization techniques in Excel. Watch and learn how to create stunning Speedometer Charts for your professional presentations and dashboards!
0:00 - Intro
1:07 - The doughnut and the pie table
2:46 - Insert and adjust the doughnut chart
5:22 - Insert and adjust the pie chart
8:38 - Adding a data label
Смотрите видео Revolutionize Dashboards: Excel Speedometers! онлайн, длительностью часов минут секунд в хорошем качестве, которое загружено на канал RBX Excel videos 16 Декабрь 2021. Делитесь ссылкой на видео в социальных сетях, чтобы ваши подписчики и друзья так же посмотрели это видео. Данный видеоклип посмотрели 1,125 раз и оно понравилось 37 посетителям.


![10 Ultra-Realistic Games Made In Unreal Engine 5 [HINDI]](https://images.reviewsvideo.ru/videos/TY38FiPysfQ)