Jiri Wiesner: Measuring latency with ftrace
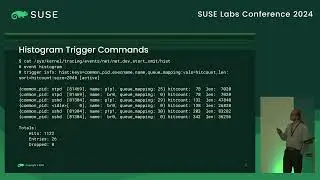
Latency is a metric indispensable for assessing performance. There are various approaches suitable for measuring latency that compute latency values in the kernel: BPF (bcc-tools, bpftrace), systemtap or custom debugging modules. At times, it may be necessary to use only ftrace because none of the other tools are available (e.g. on production servers with strict policies). Histogram triggers and synthetic events can be leveraged to compute latency in the kernel in situations when capturing a full trace is not workable. The approaches to measuring the time spent in functions and measuring scheduling latency will be discussed. Synthetic events open new ways of utilizing the snapshot trigger, which is a means to capture a full trace after an event of interest has occurred. This is an introductory talk.
Watch video Jiri Wiesner: Measuring latency with ftrace online, duration hours minute second in high quality that is uploaded to the channel SUSE Labs 10 June 2024. Share the link to the video on social media so that your subscribers and friends will also watch this video. This video clip has been viewed 125 times and liked it 5 visitors.