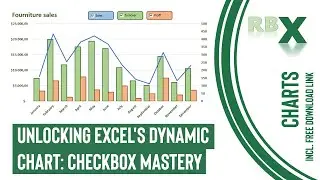
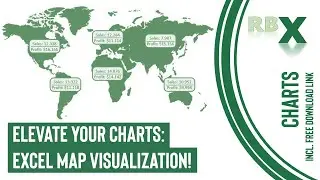
Elevate Your Charts: Excel Map Visualization!
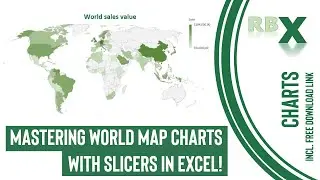
Master World Map Visualization in Excel
Discover how to craft an engaging world map chart in Excel with region-specific data showcased through custom-designed badges. This tutorial dives into creating a scatter plot-based chart with a background image of the world map. Learn how to position and customize batches to represent region data, accompanied by insightful information like sales and profit. Add and format data labels atop the batches, ensuring a visually appealing display. Elevate your chart into a captivating world map visualization effortlessly.
Download link to the file used in the video: https://drive.google.com/uc?export=do...
0:00 - Intro
0:55 - Inserting the scatter plot chart
1:12 - Adding the world map picture as background
1:55 - Adding the data series
2:35 - Fix the axis minimum and maximum
3:49 - Designing the batches
5:15 - Copy the batches in the chart
5:55 - Adding and formatting data labels in the batches
Watch video Elevate Your Charts: Excel Map Visualization! online, duration hours minute second in high quality that is uploaded to the channel RBX Excel videos 09 January 2023. Share the link to the video on social media so that your subscribers and friends will also watch this video. This video clip has been viewed 2,707 times and liked it 22 visitors.


![Invite - Foldarama [OVQVA003]](https://images.reviewsvideo.ru/videos/jsx3C3fiO-U)