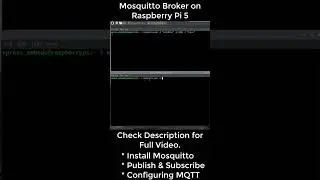
Home Weather Station Visualization using ESP32, InfluxDB & Grafana
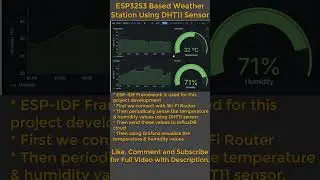
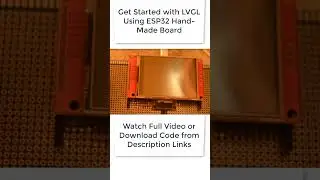
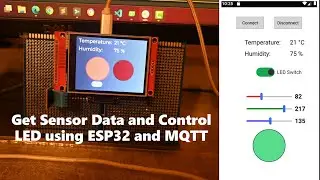
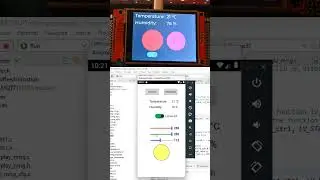
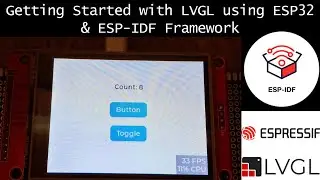
This is a major project from my side where I used ESP32S3 based development board to sense the Temperature and Humidity values from the DHT11 Sensor and then send this data to InfluxDB Cloud and then used Grafana to create beautiful looking dashboard to visualize temperature and humidity values.
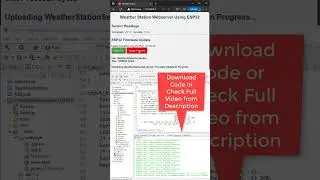
The complete code is written using the ESP-IDF Framework.
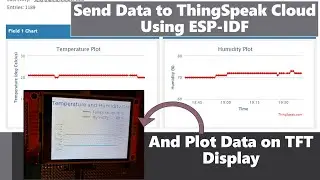
At power-up the ESP32S3 micro-controller connects with the WiFi router to connect with the internet and then synchronizes the time using SNTP protocol, if both steps are successful, then the ESP32S3 micro-controller starts the InfluxDB task and periodically fetches the temperature and humidity values from the DHT11 sensors, which are then sent to InfluxDB Open Source Cloud Platform, and then with the help of Grafan this information is fetched and the data is visualized in the form of Graphs.
While developing this project, I learned how to create and configure the account on InfluxDB and Grafana, how to send this data using "Line Protocol" to the InfluxDB cloud, and then visualize using Grafana.
The setup remains on for almost 3 days, as I am from India and it's too hot here these days with pre-monsoon showers, with this project, I visualized that whenever I turn on my water cooler the humidity increases significantly, while the temperature drops a bit.
The main project repository is as follows.
https://github.com/xpress-embedo/ESP3...
while this project is present on this path.
https://github.com/xpress-embedo/ESP3...
Let me know if you want me to make a full video tutorial on this topic.
This project is sponsored by PCBWay, with more than a decade in the field of PCB prototype and fabrication, PCBWay is committed to meeting the needs of their customers from different industries in terms of quality, delivery, cost-effectiveness, and any other demanding requests.
As one of the most experienced PCB manufacturers in the World, PCBWay prides itself on being your best business partner and a good friend in every aspect of your PCB needs.
https://www.pcbway.com/
================================
Arduino UNO: https://amzn.to/3901Dpw
Arduino Mega: https://amzn.to/2UgwA4j
ESP8266 Module: https://amzn.to/2S6EtGT
ESP32: https://amzn.to/36MEB3R
PIC Development Board: https://amzn.to/31exiAK
ARM Development Board: https://amzn.to/2S36wqO
OLED Display: https://amzn.to/36KIeXR
TFT Display: https://amzn.to/2RJgNte
Books:
Arduino: https://amzn.to/2RLkjmY
PIC: https://amzn.to/38T5uob
STM32: https://amzn.to/31cdeit
Blog Link:
embeddedlaboratory.blogspot.com
YouTube Channel:
/ embeddedlaboratory
Facebook Page:
/ embeddedlaboratory
Email Id:
[email protected]
Skype ID:
embedded.laboratory
Watch video Home Weather Station Visualization using ESP32, InfluxDB & Grafana online, duration hours minute second in high quality that is uploaded to the channel Embedded Laboratory 25 June 2024. Share the link to the video on social media so that your subscribers and friends will also watch this video. This video clip has been viewed 305 times and liked it 18 visitors.