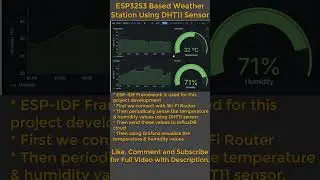
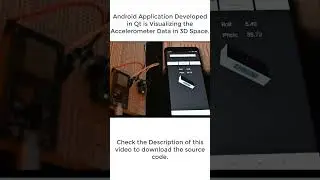
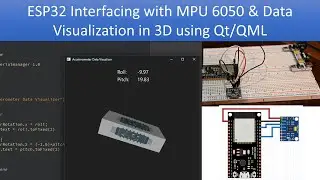
Accelerometer Data Visualization Using ESP32 and Qt6 QML
Complete Blog Page:
https://embeddedlaboratory.blogspot.c...
Full Tutorial Video:
• MPU6050 Position Visualization Using ...
Get the Qt Code:
https://github.com/xpress-embedo/Qt/t...
Get ESP32 Code
https://github.com/xpress-embedo/ESP3...
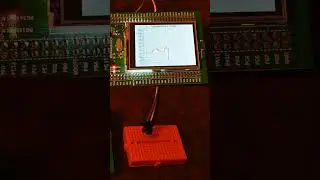
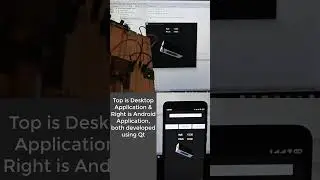
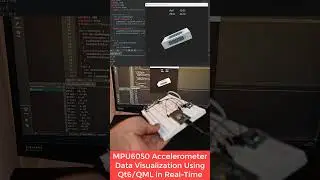
The ESP32 is connected to the MPU6050 Accelerometer sensor and sends this data to the Computer via serial port.
The data sent is roll and pitch values, which are received by the Qt application and then visualized using a cube.
The cube position itself, as per the accelerometer position.
Arduino UNO: https://amzn.to/3901Dpw
Arduino Mega: https://amzn.to/2UgwA4j
ESP8266 Module: https://amzn.to/2S6EtGT
ESP32: https://amzn.to/36MEB3R
PIC Development Board: https://amzn.to/31exiAK
ARM Development Board: https://amzn.to/2S36wqO
OLED Display: https://amzn.to/36KIeXR
TFT Display: https://amzn.to/2RJgNte
Books:
Arduino: https://amzn.to/2RLkjmY
PIC: https://amzn.to/38T5uob
STM32: https://amzn.to/31cdeit
Blog Link:
embeddedlaboratory.blogspot.com
YouTube Channel:
/ embeddedlaboratory
Facebook Page:
/ embeddedlaboratory
Email Id:
[email protected]
Skype ID:
embedded.laboratory
Watch video Accelerometer Data Visualization Using ESP32 and Qt6 QML online, duration hours minute second in high quality that is uploaded to the channel Embedded Laboratory 26 July 2023. Share the link to the video on social media so that your subscribers and friends will also watch this video. This video clip has been viewed 769 times and liked it 30 visitors.