Weibull Probability Plotting of Right Censored Data on Excel
Dear friends,
We are happy to release this 97th video!
Many of you have requested to make this video on Weibull Probability Plotting of Right Censored Data. In this video, Hemant Urdhwareshe, Fellow of ASQ, explains how to construct a Weibull Probability Plot when the data is Right Censored! Hemant has illustrated the complete procedure, step by step, using Microsoft Excel, with an Application Example!
Useful links to our earlier videos on Weibull Distribution and Probbaility plotting are mentioned below:
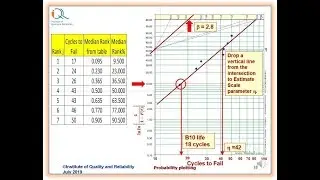
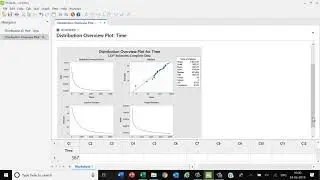
(1) Weibull Probability Plotting of Complete Data: • Weibull Probability Plotting of compl...
(2) Weibull Probability Plotting on Minitab: • Life Data Analysis of Right Censored ...
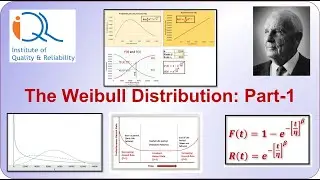
(3) Weibull Distribution Part-1: • Weibull Distribution Part-1
(4) Weibull Distribution Part-2: • Weibull Distribution Part2: Three-Par...
We hope you find this video interesting and useful! Happy learning!
Смотрите видео Weibull Probability Plotting of Right Censored Data on Excel онлайн, длительностью часов минут секунд в хорошем качестве, которое загружено на канал Institute of Quality and Reliability 28 Ноябрь 2023. Делитесь ссылкой на видео в социальных сетях, чтобы ваши подписчики и друзья так же посмотрели это видео. Данный видеоклип посмотрели 3,200 раз и оно понравилось 48 посетителям.