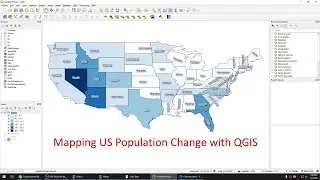
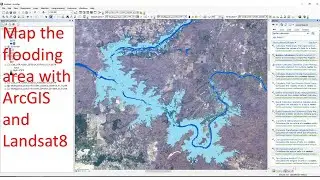
Map the flooding area with ArcGIS and Landsat8
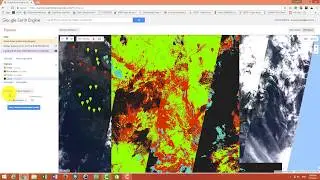
This video demonstrate the easy and reliable method for mapping the flood area using ArcGIS with only raster calculator. I used only the near infrared band for identifying the flooding area due to the lowest reflection value from water. Also, to identified the change area I multiplied the first image with 10 and plus the value of second image so that the output will be have the value as:
11 Water in 2020 &2015 ,
10 Water in 2020 only,
1 Water in 2015 only,
0 No water in both year.
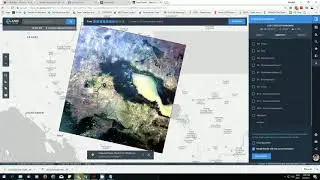
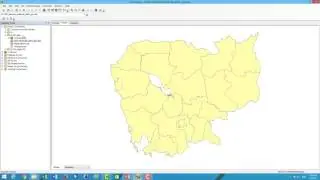
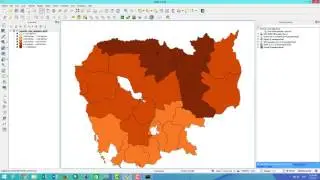
The study area in this video is a reservoir of Lower Sesan hydropower dam in Cambodia. It is the biggest dam in the country.
Watch video Map the flooding area with ArcGIS and Landsat8 online, duration hours minute second in high quality that is uploaded to the channel Punwath Prum 07 February 2020. Share the link to the video on social media so that your subscribers and friends will also watch this video. This video clip has been viewed 15,352 times and liked it 154 visitors.