How to Combine Character String & Expressions in Plot Text in R (2 Examples) | Base R vs. ggplot2
How to add a text with expressions to a plot in the R programming language. More details: https://statisticsglobe.com/combine-c...
R code of this video:
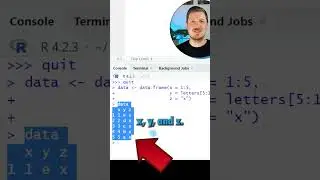
data <- data.frame(x = 1:5, # Create example data frame
y = c(1, 3, 5, 2, 7))
plot(data, # Draw plot without expressions
main = "My Main Title")
plot(data, # Draw plot with expressions in main title
main = expression("My Main Title"["No. 2"] ~ alpha ^ beta))
install.packages("ggplot2") # Install & load ggplot2
library("ggplot2")
ggp <- ggplot(data, aes(x, y)) + # Create ggplot2 scatterplot
geom_point()
ggp # Draw ggplot2 scatterplot
ggp + # Add main title without expressions
ggtitle("My Main Title")
ggp + # Add main title with expressions
ggtitle(expression("My Main Title"["No. 2"] ~ alpha ^ beta))
ggp + # Annotate text with expressions inside of plot
annotate("text",
x = 2,
y = 4,
label = expression("My Text"["No. 2"] ~ alpha ^ beta))
ggp +
annotate("text",
x = 2.2,
y = 4,
label = expression("My Text"["No. 2"] ~ alpha ^ beta),
col = 2,
size = 5)
Follow me on Social Media:
Facebook – Statistics Globe Page: / statisticsglobecom
Facebook – R Programming Group for Discussions & Questions: / statisticsglobe
Facebook – Python Programming Group for Discussions & Questions: / statisticsglobepython
LinkedIn – Statistics Globe Page: / statisticsglobe
LinkedIn – R Programming Group for Discussions & Questions: / 12555223
LinkedIn – Python Programming Group for Discussions & Questions: / 12673534
Twitter: / joachimschork
Music by bensound.com
Watch video How to Combine Character String & Expressions in Plot Text in R (2 Examples) | Base R vs. ggplot2 online, duration hours minute second in high quality that is uploaded to the channel Statistics Globe 19 December 2022. Share the link to the video on social media so that your subscribers and friends will also watch this video. This video clip has been viewed 451 times and liked it 18 visitors.