DOE-7: Analyse Factorial Design with Minitab: Case Study in Maximizing Fatigue Strength
Dear friends, this is part-2 of our video on Design of Experiments using Minitab. In part-1, Hemant Urdhwareshe had explained how to create design using Minitab. In this part-2 of the video, Hemant has illustrated complete details of analysis of the design using Minitab. Analysis includes interpretation of Minitab output in voice and text!
We are sure, you will find this video extremely useful for Quality Practitioners, Reliability Engineers, Design and Process Engineers, Six Sigma Professionals, Design for Six Sigma practitioners.
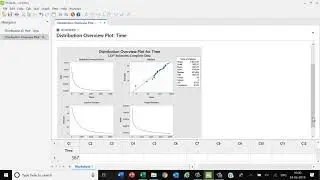
Some corrections at 5:21 -- The R-sq value is 95.45, R-sq Adjusted is 92.53 and R-sq Predicted is 86.63%. There is some error in these figures in the video. Apologise for the oversight.
We recommend that viewers should see our previous videos on Design of Experiments before viewing this video. Here are links to our previous videos on DOE:
Introduction to DOE: • DOE-1: Introduction to Design of Experiments
Application of DOE to Spot Welding using Excel: • DOE-2: Application of Design of Experiment...
Coded and Uncoded Values and Developing Regression Equation: • DOE-3: Design of Experiments: Coded and Un...
Fractional Factorial Designs: • DOE-5: Fractional Factorial Designs, Confo...
DOE-6: Case Study in Creating Full Factorial Design in Minitab: Optimization of Fatigue Strength
• DOE-6: Case Study in Creating Full Factori...
Watch video DOE-7: Analyse Factorial Design with Minitab: Case Study in Maximizing Fatigue Strength online, duration hours minute second in high quality that is uploaded to the channel Institute of Quality and Reliability 26 May 2020. Share the link to the video on social media so that your subscribers and friends will also watch this video. This video clip has been viewed 30,745 times and liked it 475 visitors.