Add Standard Error Bars to Barchart (2 Examples) | Draw Barplot in Base R & ggplot2 | stat_summary()
How to create a barplot with standard error (SE) bars in the R programming language. More details: https://statisticsglobe.com/add-stand...
R code of this video:
set.seed(37924) # Create example data frame
data <- data.frame(values = rnorm(100, 2),
group = letters[1:4])
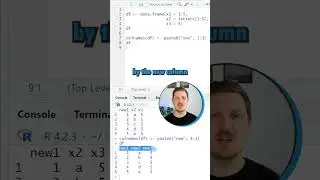
data_summary <- aggregate(values ~ group, data, # Create summary data
function(x) c(mean = mean(x),
se = sd(x) / sqrt(length(x))))
data_summary <- data.frame(group = data_summary[ , 1], data_summary$values)
data_summary # Print summary data
base_r_barplot <- barplot(data_summary$mean ~ group, # Draw and store Base R barplot
data_summary,
ylim = c(0, 2.7))
arrows(x0 = base_r_barplot, # Add error bars
y0 = data_summary$mean + data_summary$se,
y1 = data_summary$mean - data_summary$se,
angle = 90,
code = 3,
length = 0.1)
install.packages("ggplot2") # Install & load ggplot2 package
library("ggplot2")
ggplot(data, aes(values, group, fill = group)) + # ggplot2 barplot with error bars
coord_flip() +
stat_summary(geom = "bar", fun = mean, position = "dodge") +
stat_summary(geom = "errorbar", fun.data = mean_se, position = "dodge")
Follow me on Social Media:
Facebook – Statistics Globe Page: / statisticsglobecom
Facebook – R Programming Group for Discussions & Questions: / statisticsglobe
Facebook – Python Programming Group for Discussions & Questions: / statisticsglobepython
LinkedIn – Statistics Globe Page: / statisticsglobe
LinkedIn – R Programming Group for Discussions & Questions: / 12555223
LinkedIn – Python Programming Group for Discussions & Questions: / 12673534
Twitter: / joachimschork
Music by bensound.com
Watch video Add Standard Error Bars to Barchart (2 Examples) | Draw Barplot in Base R & ggplot2 | stat_summary() online, duration hours minute second in high quality that is uploaded to the channel Statistics Globe 04 July 2022. Share the link to the video on social media so that your subscribers and friends will also watch this video. This video clip has been viewed 6,750 times and liked it 82 visitors.