Build Data-driven Applications Directly From Your Pandas or Xarray Pipelines | PyData Global 2021
Build Polished, Data-driven Applications Directly From Your Pandas or Xarray Pipelines
Speaker: Philipp Rudiger
Summary
What if building a data-science app could be as easy as replacing arguments in your data pipelines with widgets? Panel and hvPlot .interactive allow you to leverage the APIs you already know (Pandas, Xarray, Dask, cuDF, etc.) to build everything from one-off interactive applets all the way up to full-featured polished web applications.
Description
What if building a data-science app out of your analysis code could be as easy as replacing any argument with a widget? By combining the power of PyData APIs you already use (whether Pandas, Xarray, Dask, cuDF, etc.), the new hvPlot .interactive API, and Panel’s ability to iteratively build polished web applications, you can now build reactive, data-driven apps and dashboards in just a few lines of code.
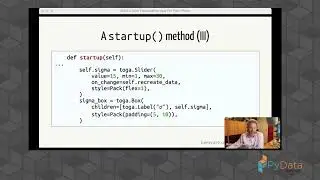
Instead of having to learn how to write and debug complex callbacks and event loops, with .interactive you build a reactive application using the same data-handling APIs you are already comfortable with. With .interactive, hvPlot captures your specified pipeline of operations along with which widgets to use for each call, and replays the pipeline whenever the corresponding widget value changes. For instance, you can explore a DataFrame one group at a time by filtering using an interactive selector widget: df.interactive[df.type == selector].head(). Each time the selector value changes, hvPlot will re-run your specified operations to get a new result to be displayed by Panel.
This approach scales from simple expressions to long or complex data-transformation pipelines leading to any supported Panel output type, from simple text to BI indicators, tables, and plots (Bokeh/Matplotlib/Plotly/Altair/DeckGL and many more).
In your favorite development environment (whether that is Jupyter(Lab) or your favorite editor), you can quickly and iteratively integrate these data-driven components into a full application. As a final step, you can easily combine the power of these APIs with the inbuilt Panel templates to build polished-looking web applications that are easy to deploy on your favorite web-hosting service.
Philipp Rudiger's Bio
A long-term veteran at Anaconda Inc., Philipp Rudiger is a Senior Software Engineer developing open-source and client-specific solutions for data management, visualization and analysis. He is the author of the open source dashboarding and visualization libraries Panel, hvPlot and GeoViews and one of the core developers of Bokeh and HoloViews. Before making the switch to software development he completed a PhD and Masters in Computational Neuroscience at the University of Edinburgh working on biologically inspired, deep and recurrent neural network models of the visual system.
GitHub: https://github.com/philippjfr/
Twitter: / philippjfr
PyData Global 2021
Website: https://pydata.org/global2021/
LinkedIn: / pydata-global
Twitter: / pydata
www.pydata.org
PyData is an educational program of NumFOCUS, a 501(c)3 non-profit organization in the United States. PyData provides a forum for the international community of users and developers of data analysis tools to share ideas and learn from each other. The global PyData network promotes discussion of best practices, new approaches, and emerging technologies for data management, processing, analytics, and visualization. PyData communities approach data science using many languages, including (but not limited to) Python, Julia, and R.
PyData conferences aim to be accessible and community-driven, with novice to advanced level presentations. PyData tutorials and talks bring attendees the latest project features along with cutting-edge use cases.
00:00 Welcome!
00:10 Help us add time stamps or captions to this video! See the description for details.
Want to help add timestamps to our YouTube videos to help with discoverability? Find out more here: https://github.com/numfocus/YouTubeVi...
Watch video Build Data-driven Applications Directly From Your Pandas or Xarray Pipelines | PyData Global 2021 online, duration hours minute second in high quality that is uploaded to the channel PyData 09 January 2022. Share the link to the video on social media so that your subscribers and friends will also watch this video. This video clip has been viewed 2,110 times and liked it 69 visitors.